
Every flight in this country begins, whether we admit it or not, with a weather decision. Australia serves up an extraordinary menu: tropical monsoons and dry-season trade winds in the north, roaring-forties fronts in the south, fog-filled inland valleys in winter, 45-degree density altitudes in summer, and a coastline that manufactures its own winds on schedule. The pilots who handle it well aren't the ones who memorised the most theory — they're the ones who've learned to read the weather: to start with the synoptic picture, drill into the right products, and overlay the local knowledge that no forecast fully captures.
Start with the big picture
Australian weather is organised by one dominant feature: the subtropical ridge, the belt of high pressure that migrates north in winter and south in summer. In winter the ridge sits over the continent, leaving the southern states exposed to the procession of cold fronts embedded in the westerlies — one every few days, each with its pre-frontal northwesterly, its wind change, and its post-frontal showers. In summer the ridge slides south, the fronts mostly pass below the mainland (Tasmania still collects them), and the action moves north: heat troughs inland, sea breezes on every coast, and the monsoon trough draped across the Top End with thunderstorms and, from November to April, tropical cyclones.
Hold that seasonal rhythm in your head and the daily Mean Sea Level Pressure (MSLP) chart — issued by the Bureau of Meteorology several times a day — starts to tell you a story rather than just showing you squiggles.
Reading the chart itself is a skill worth deliberate practice. Isobar spacing is a wind forecast: tight gradient means wind, slack gradient means calm — and calm, in winter, means fog. Highs mean subsiding air, inversions, smooth flying and trapped haze; their light-wind clear-sky nights are exactly the conditions for radiation fog and frost inland. Lows and fronts bring the obvious — wind shifts, lowering cloud, showers, turbulence — but the chart's subtler features earn their keep too: dashed trough lines that mark convergence, instability and often the trigger for thunderstorms; the west coast trough that governs Perth's weather; the heat troughs of summer; and, in the wet season, the monsoon trough itself.
A worked example: reading a real chart
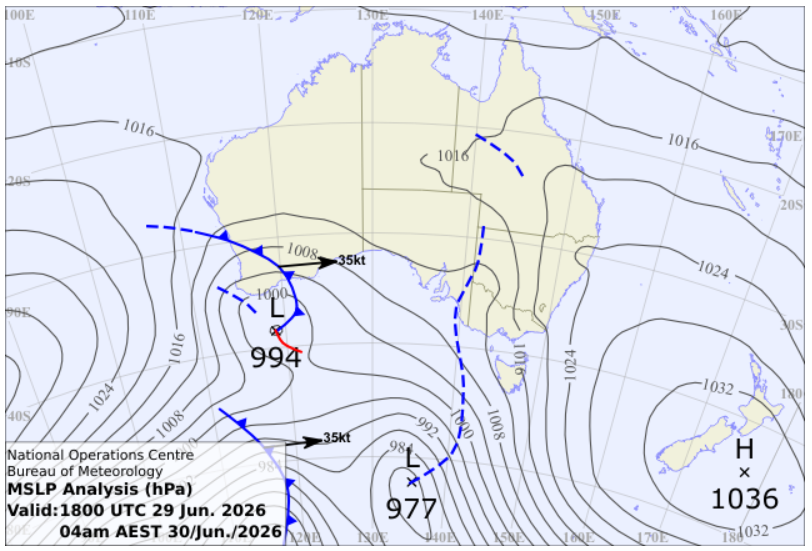
Take the analysis above — a Bureau MSLP chart valid at 4am AEST on 30 June, deep in the southern winter. Reading it as a pilot, four features jump out.
The high east of New Zealand (1036 hPa). A big winter high ridging back over eastern Australia. For NSW and Victoria that means slack gradient, clear skies and long winter nights — textbook radiation fog and frost country. If you're planning a dawn departure from Wagga Wagga, Orange, Dubbo or Canberra under this pattern, expect the TAF to carry fog risk, plan fuel for the alternate or the holding, and don't be surprised when the airport disappears at 7am under a sky that was CAVOK at midnight. The flying above the fog layer will be glass-smooth: that's the inversion doing its work.
The low southwest of WA (994 hPa) and its cold front, moving east at 35 knots. Southern WA is about to get a classic frontal passage: freshening northwesterlies ahead of the front, then the change — wind veering sharply southwest, a burst of showers, a lowering cloud base, blustery low-level turbulence — then cold, showery, unstable air behind it. Anyone operating Perth–Esperance–Albany way should be reading TAFs for INTER and TEMPO periods and expecting a bumpy, showery day.
The deep low south of the Bight (977 hPa) with a trough arcing north. This is the engine room. Over the following 24–48 hours this system drives the frontal band across the Bight into SA, Victoria and Tasmania. Ahead of it: strong, warm northerly flow — and over the Alps and Great Dividing Range, strong northwest flow aloft is the recipe for mountain wave, with severe turbulence SIGMETs a fair bet. Behind it: a plunging freezing level, showers, and airframe icing in cloud at altitudes light aircraft actually use. Bass Strait, as ever, cops the worst of the gradient.
The north: slack isobars around 1016. It's the dry season. Darwin and the Top End sit under gentle southeasterly trades — day after day of fine, stable flying weather, with just a morning inversion to burn off. The same chart in January would look, and mean, something utterly different.
That's the discipline: every chart gets translated into wind, cloud, turbulence, icing and fog risk for your route, before you ever open a TAF.
From the chart to the briefing: Australia's product stack
The synoptic chart tells you what kind of day it is. The operational products — laid out in AIP GEN 3.5, with the Bureau of Meteorology as the responsible service — tell you the specifics. A practical tour, in the order you'll meet them in a NAIPS briefing:
Graphical Area Forecast (GAF). The workhorse for operations from the surface to 10,000 ft. Australia is carved into ten GAF areas (as shown on the Planning Chart Australia), each forecast as a map divided into zones of common weather with a supporting table — cloud, visibility, weather, freezing level. GAFs run on six-hour validity periods, issued in pairs covering twelve hours, at least 30 minutes before validity starts. Buried in some GAFs are forecasts for critical locations — Bowral, Mount Victoria and Murrurundi in NSW, Kilmore Gap in Victoria — the low-level VFR chokepoints through the ranges where the weather matters most and observations are thinnest.
Grid Point Wind and Temperature (GPWT) and Route Sector Winds (RSWT). Your planning winds. GPWT charts give model-derived wind and temperature at grid points; RSWT covers the frequently flown route sectors.
TAF and METAR/SPECI. The aerodrome layer. A TAF covers a radius of 8 km around the aerodrome reference point — and note a detail that catches people: in TAFs, cloud heights are given above aerodrome elevation, whereas other forecasts use AMSL or flight levels. TAF service depends on the aerodrome's category: major ports get TAF3 (reissued every three hours, with the MET office actively watching for amendments — identified by "TAF3" in the remarks), internationals and large aerodromes get six-hourly issues with 12–30 hour validity, and small country fields may only get one or two short TAFs a day. METARs come every half hour; a SPECI arrives whenever an observed element hits criteria that matter to you — and a string of SPECIs is itself a weather report: something is happening.
SIGMET and AIRMET. SIGMETs — issued by the Melbourne and Brisbane MET Watch Offices, generally with four hours' validity (six for volcanic ash and tropical cyclone) — cover phenomena hazardous to all aircraft: severe turbulence, severe icing, thunderstorm areas, TCs, ash. AIRMETs cover the lesser-severity low-level phenomena below 10,000 ft that weren't in the current GAF. The quiet obligation running the other way: pilots are asked to fire off an AIREP Special whenever they meet hazardous conditions that might warrant a SIGMET — the system runs on our reports as much as the Bureau's models.
The niche players worth knowing. Airport Weather Briefings expand on the TAF at the majors (Darwin's runs only in the wet season — telling in itself). Wind shear warnings and, at equipped aerodromes, automated alerts: ATC will call "wind shear alert" for a 15-knot headwind gain or loss on the corridor, and "microburst alert" for a 30-knot loss — words that should end any approach briefing debate instantly. AWIS numbers put real-time automatic weather station data one phone call (or VHF broadcast) away — invaluable at uncontrolled fields. And VOLMET still broadcasts METAR/SPECI around the clock on HF-era frequencies: Mt Ginini on 128.65, for instance, reads Canberra, Wagga Wagga, Melbourne, Adelaide and Hobart to anyone who tunes in.
The network layer: the ATFM Daily Plan. One product most GA pilots have never heard of and most airline pilots check daily: the ATFM Daily Plan (ADP), published by Airservices' National Operations Management Centre. It opens with a BOM-briefed overview of national and capital-city weather, then translates it into operational consequences — expected runway configurations, arrival acceptance rates and ground delay programs at the majors. It's explicitly not for flight planning, but it answers the question the TAF can't: what is this weather going to do to the network today? If Sydney's on a single-runway westerly or Perth's morning fog has triggered a GDP, the ADP knew before your delay did. The same NOMC page also hosts Airservices' live weather cameras — a genuinely useful glance at actual conditions at dozens of aerodromes.
Where weather meets the rule book
An INTER on the TAF costs 30 minutes of holding fuel; a TEMPO costs 60. Multiple periods aren't cumulative — carry the most limiting. A FM or BECMG introducing an operational requirement bites from 30 minutes before the change time. That buffer catches anyone who plans to sneak in just ahead of the front.
Reading weather in Australia also means reading its operational consequences, because the AIP hard-wires forecasts into fuel and alternate requirements. The alternate rules live in AIP ENR 1.1 section 10.7 (Part 121 operators have their own version in the Part 121 MOS), and they're built around a simple question: what does the forecast say for your arrival window? Unless you're VFR by day within 50 NM of departure, you must provide for a suitable alternate when arrival falls during — or up to 30 minutes before the forecast start of — any of the following: cloud more than SCT below the alternate minimum; visibility below the alternate minimum; visibility above the minimum but with a 30% or greater probability of fog, mist or dust taking it below; thunderstorms or severe turbulence, or a PROB30 of them; or a crosswind or tailwind beyond your aircraft's limits, gusts included. And no valid forecast at all means an alternate that has one.
Two traps inside that list. First, cloud amounts below the alternate minimum are cumulative: FEW plus FEW counts as SCT, FEW plus SCT as BKN, SCT plus SCT as BKN or OVC — so two innocuous-looking FEW layers on a TAF can quietly trigger the requirement. Second, know what "the alternate minimum" actually is for you. For aeroplanes under the VFR, day or night, it's a ceiling of 1,500 ft and 8 km visibility. For IFR flights it's the alternate minima published on the instrument approach chart — for a procedure you can actually conduct — while by day, at an aerodrome with no usable IAP, it becomes the final-route-segment LSALT plus 500 ft with 8 km. At night the chart minima are the only game in town: a night IFR destination without a usable approach forces you to plan an alternate that has one.
Then come the relief valves. Deteriorations forecast as INTER or TEMPO can be covered with 30 or 60 minutes of holding fuel instead of an alternate (see the box above), and the requirement only bites when your ETA falls within 30 minutes either side of the forecast deterioration period. Best of all, at aerodromes with a TAF3 service — the majors, with the MET office actively amending — the 30-minute buffers and the PROB30/40 thunderstorm and visibility-probability requirements are switched off during the first three hours of TAF3 validity. That single paragraph of AIP is why a TAF3 port can be legal to plan into when the same forecast at a country field would demand an alternate.
QNH has its own trap. An actual aerodrome QNH from an approved source (ATC, ATIS, AWIS, an accredited observer — not the METAR) is valid for just 15 minutes. Fly an approach on forecast area QNH and you must add 50 ft to the minima; conversely, charts with shaded minima are built on TAF QNH and may be reduced by 100 ft once you've set an actual. On a marginal NDB or RNP approach into a country strip, that 150-foot swing is the difference between seeing the runway and going around.
Local knowledge: what the forecast assumes you already know
Every experienced pilot carries a private gazetteer of place-specific weather. Some entries every Australian pilot should have:
Sydney and the NSW coast — the southerly buster. On a hot day with a front approaching, the cool change gets trapped against the Great Dividing Range and distorts into a shallow, fast-moving southerly surge that can arrive almost unannounced: 30–40 knots of wind shift in minutes, a temperature crash, runway changes and go-arounds at Sydney. If the chart shows a front and the day is hot and northeasterly, the buster is on the menu — watch for the SPECI at Nowra and Wollongong before it hits Botany Bay.
The NSW coast in autumn and winter — east coast lows. These maritime lows can spin up rapidly off the coast, delivering gales, driving rain and days of low cloud from the Illawarra to the Hunter. When the models hint at one, expect the coastal TAFs to go ugly fast and stay ugly.
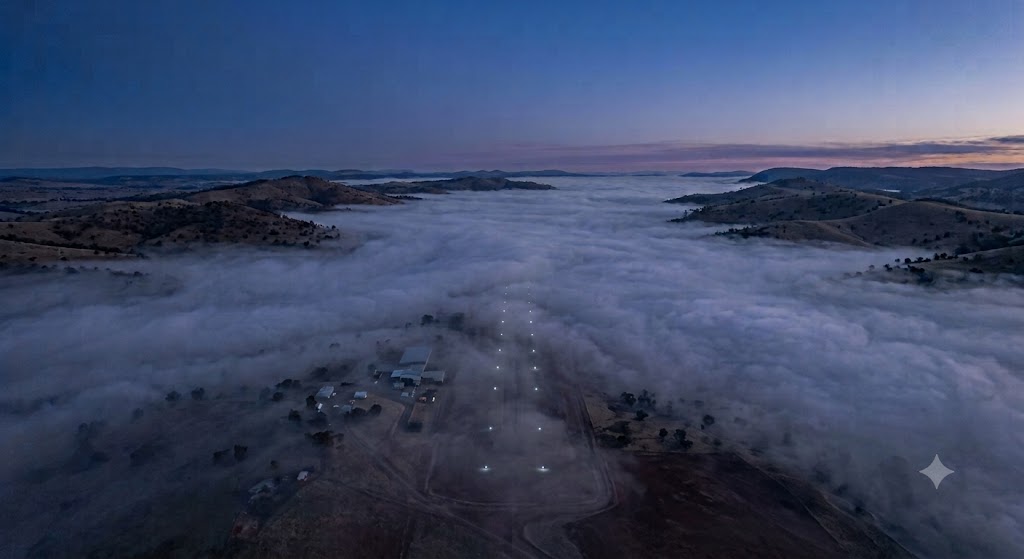
Canberra and the inland southeast — fog and frost. Cold air drains into the valleys on clear winter nights under a ridge; Canberra, Wagga, Orange and friends fog in at dawn and clear mid-morning. The pattern is so reliable you can plan around it: schedule after the burn-off, or carry the holding fuel and expect to use it.
Melbourne and Victoria — the four-seasons cliché is a flight brief. Pre-frontal days bring hot, gusty northerlies and severe turbulence off the ranges; the change brings a hard wind swing and a line of showers. Kilmore Gap — one of the GAF's designated critical locations — is the low-level gateway between Melbourne and the north, and when it's below VFR minima, the honest options are IFR, the long way round the terrain, or the ground. It earns its AWIS.
Bass Strait and Tasmania — the forties, roaring. Fronts arrive in quick succession, the gradient is routinely gale-force, and strong westerlies over the island's mountains produce serious lee turbulence and wave. Treat every Strait crossing as a weather briefing exercise in its own right.
Perth and the WA coast — the Fremantle Doctor and the west coast trough. Summer mornings often bring fresh gusty easterlies off the scarp; by afternoon the Doctor — the sea breeze that gives Perth its summer character — swings the wind southwest at 15–25 knots, on schedule. The position of the west coast trough decides which regime wins, and a trough moving inland then snapping back is the classic Perth wind-shift day. The easterlies have a night shift too: on clear, calm nights, cool air drains katabatically down the Darling Scarp and reinforces the gradient, so the gusty east wind often peaks in the hours around dawn — expect it bumpy and shearing on the eastern side of the circuit at Jandakot and on approaches near the foothills, easing once the sun gets to work and the boundary layer mixes out.
Darwin and the Top End — two seasons, two aviations. The dry (May–September) is benign trade-wind flying. The build-up and the wet are a different job: towering afternoon storms, gusty squalls, and the monsoon's low cloud and rain. The most famous single storm in the country — Hector — fires over the Tiwi Islands on most wet-season afternoons with such regularity that wartime pilots used it as a navigation fix. Cyclone season runs November to April, watched by Darwin's Tropical Cyclone Advisory Centre.
The Gulf of Carpentaria — the Morning Glory. In early spring, colliding Cape York sea breezes launch spectacular roll clouds that sweep across the Gulf toward Burketown at dawn — a pilgrimage for glider pilots, and a low-level wind shear hazard for everyone else.
The outback anywhere in summer. Density altitude is the quiet killer — a 45-degree afternoon turns a sea-level strip into a hot-and-high one — and dust devils (willy-willies) can flip a light aircraft on the ground. Morning is the outback pilot's friend.
Building your own local knowledge
None of the above is in a TAF. It accumulates — so accumulate it deliberately. Quiz local instructors and station pilots before flying into new country. Save the AWIS numbers along your routes and ring them out of curiosity, not just necessity. Make a habit of comparing yesterday's forecast with what actually happened at your home field; the Bureau's radar, satellite and MetEye tools make the post-mortem easy. File AIREPs — the next pilot's briefing depends partly on yours. And keep looking at the synoptic chart every day, including days you don't fly. Fluency comes from volume, and the chart is published rain, hail or shine.
The forecast is a prediction; the chart is a story; local knowledge is the footnotes. Read all three together and Australian weather stops being a series of surprises and becomes what it should be for a professional pilot: just another part of the plan.
Further reading
- BOM Aviation Weather Services — the operational portal: GAFs, GPWT, SIGMET/AIRMET, charts and warnings.
- BOM Aviation Knowledge Centre — plain-language product guides and hazardous-weather explainers.
- BOM — Graphical Area Forecasts and the GAF Reference Card (PDF) — decoding the GAF layout and abbreviations.
- AIP Australia GEN 3.5 (Meteorological Services) and ENR 1.1/1.5/1.10 — the source for products, INTER/TEMPO holding, alternate and QNH rules, via Airservices Australia AIP.
- NAIPS Internet Service — flight briefings, GAFs, charts and submission of flight notification.
- Airservices NOMC — ATFM Daily Plan and live weather cameras — the network view: BOM-briefed outlooks, runway configurations and ground delay programs.
- BOM — The big bust: southerly busters explained and Meet the locals: when the weather gives the place character.
- Weatherzone — Winds of Australia — a tour of the Fremantle Doctor, southerly buster and friends.
This article is general information current as at July 2026 and is not a substitute for a proper pre-flight weather briefing, current CASA guidance or official Bureau of Meteorology products. Always obtain an official briefing before flight. Synoptic chart © Bureau of Meteorology. Written by David Roses. Not affiliated with CASA or the Bureau of Meteorology.